About the course
THE COMPLETE DATA ANALYST COURSE
Every company talks about being “data-driven”, but most don’t have the practical skills to actually analyse data and extract insights. This course changes that.
Companies need data analysts who can DO the work—clean messy data, build visualisations that tell stories and extract insights that drive decisions.
Most courses teach theory or focus on single tools. Few teach the complete practical toolkit: Excel for quick analysis, Python for automation, SQL for databases, and visualisation techniques that make insights impossible to ignore.
That’s exactly why I built this course.
I’m Jenson Berry, and I started my career doing contract data analysis and data architecture work. I learned Excel, Python, and SQL by solving real client problems with messy data and tight deadlines—not from academic textbooks. This was my first course, built from that hands-on experience. Since launching, 400+ students have learned data analysis through the practical, project-focused approach that worked for me professionally. You’ll learn the complete data analyst toolkit through real projects that prove you can do the work.
400+
Students
80+
Lectures
4.6/5
Rating
15+
Hours
COURSE OVERVIEW
WHAT YOU’LL LEARN

MASTER EXCEL FOR DATA ANALYSIS
Use PivotTables, advanced formulas, and data visualization to analyze data quickly and present insights professionally
LEARN TO PROGRAM WITH PYTHON
Write Python code to automate data cleaning, manipulation, and analysis tasks that would take hours in Excel

MANIPULATE DATA WITH PANDAS
Handle complex datasets, merge multiple data sources, and transform raw data into analysis-ready formats

VISUALISE DATA EFFECTIVELY
Create compelling charts with Matplotlib and Seaborn that communicate insights clearly to non-technical audiences
QUERY DATABASES WITH SQL
Extract and analyze data from databases, join tables, and write queries that answer business questions
BUILD MACHINE LEARNING MODELS
Apply Scikit-Learn to create predictive models and understand the fundamentals of machine learning for data analysis
THE OPPORTUNITY
THE DATA ANALYST OPPORTUNITY
THE DATA ANALYST SKILLS GAP
Every company talks about being “data-driven” but most struggle to find people who can actually analyze data and extract insights.
Data analysts are among the most in-demand roles globally. Organisations need professionals who can clean messy data, build meaningful visualisations, and communicate insights that drive business decisions.
The barrier? Most people have Excel basics but lack Python, SQL, and the systematic approach needed for real data analysis work.
This course teaches the complete practical toolkit—Excel for quick wins, Python for automation, SQL for databases, and visualisation for presenting insights. You’ll learn by building real projects, not memorising theory.
High Demand
Data analyst roles are projected to grow 23% through 2022 and 2032, much faster than the average for all occupations.
Organisations across all sectors need data analysis skills, and workers across all areas can benefit from data analysis skills.
Remote Friendly
Most data analyst roles offer remote or flexible work. Analyse data from anywhere with just a laptop and internet connection.
Practical Skills
Not theory-heavy. Learn tools and techniques you’ll use daily: Excel, Python, SQL, and data visualization.
Portfolio Ready
Build real projects that prove you can do the work. Show employers hands-on experience, not just certificates.
COURSE OVERVIEW
What’s Inside
Data Analysis Fundamentals
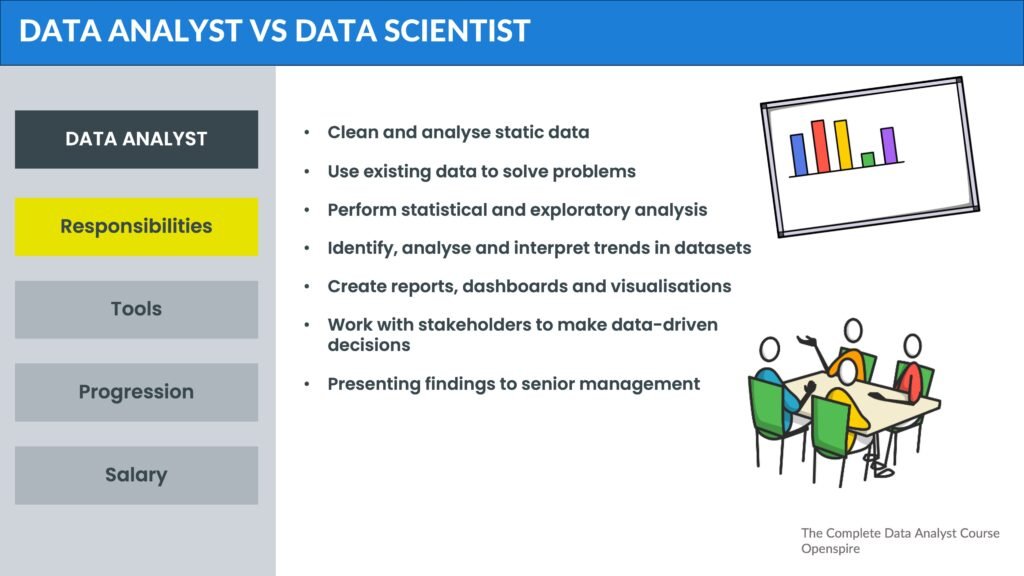
Understand what data analysts do, types of data, the complete analysis process, and career paths in data analysis. Learn the difference between data analysts and data scientists.
Microsoft® Excel Crash Course
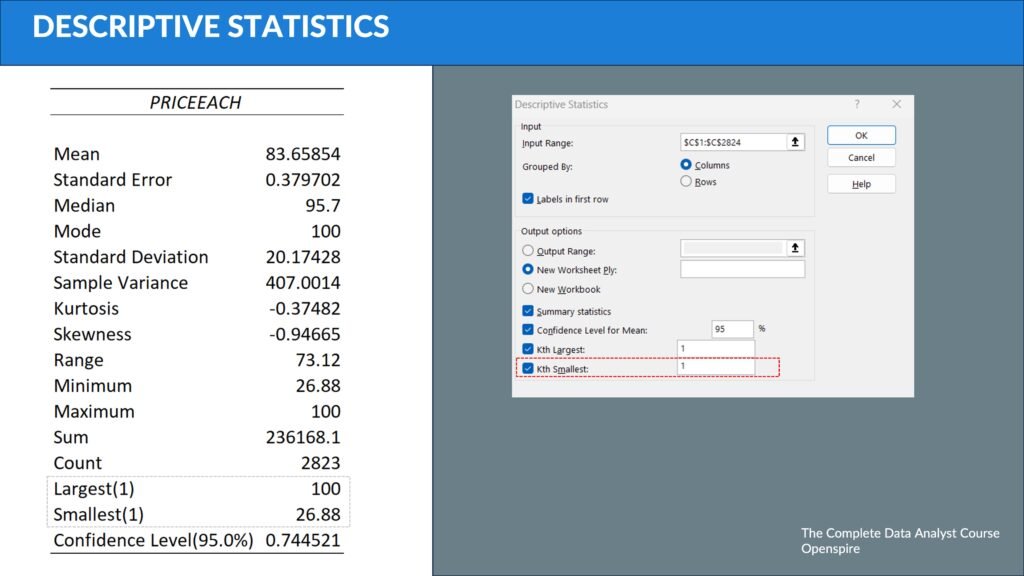
Master Excel for data analysis—essential formulas and functions, data cleaning techniques, PivotTables and PivotCharts, conditional formatting, and creating professional dashboards for business insights.
Python Foundations
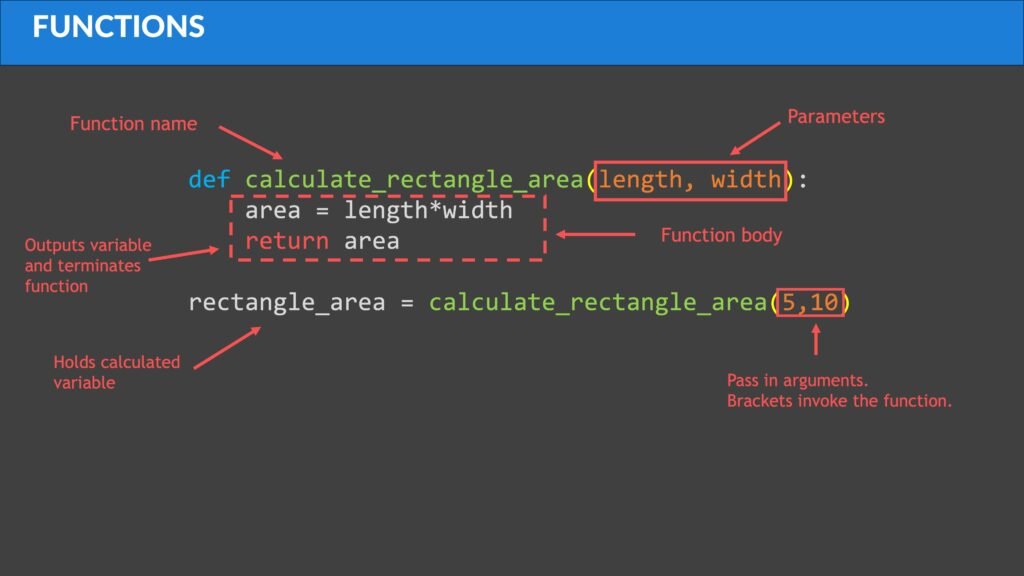
Learn Python from scratch—data types and variables, control structures, functions and modules, and programming fundamentals needed for data analysis work.
NumPy for Numerical Data
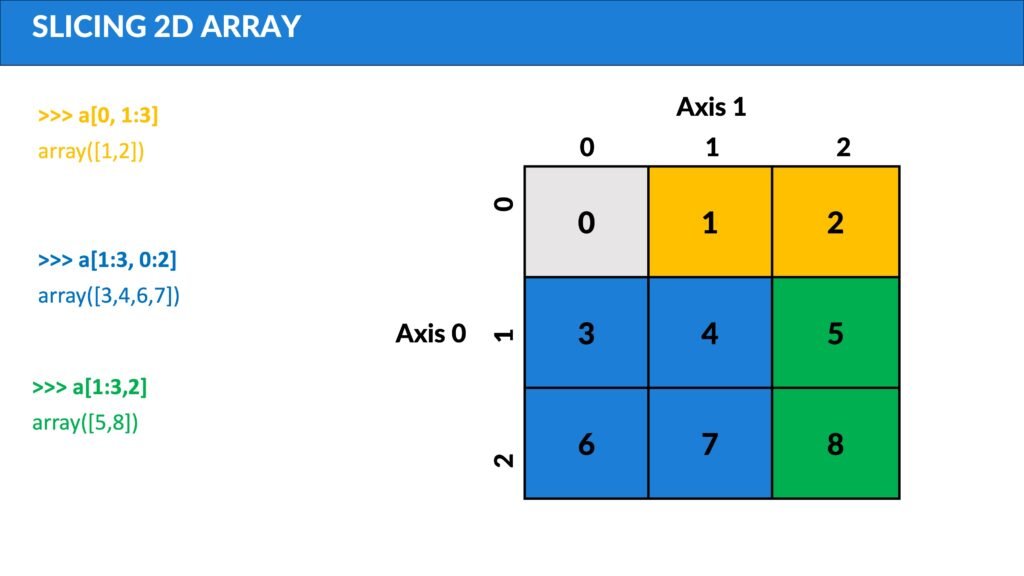
Use NumPy for efficient numerical operations, array manipulation, indexing and slicing, and mathematical computations essential for data analysis.
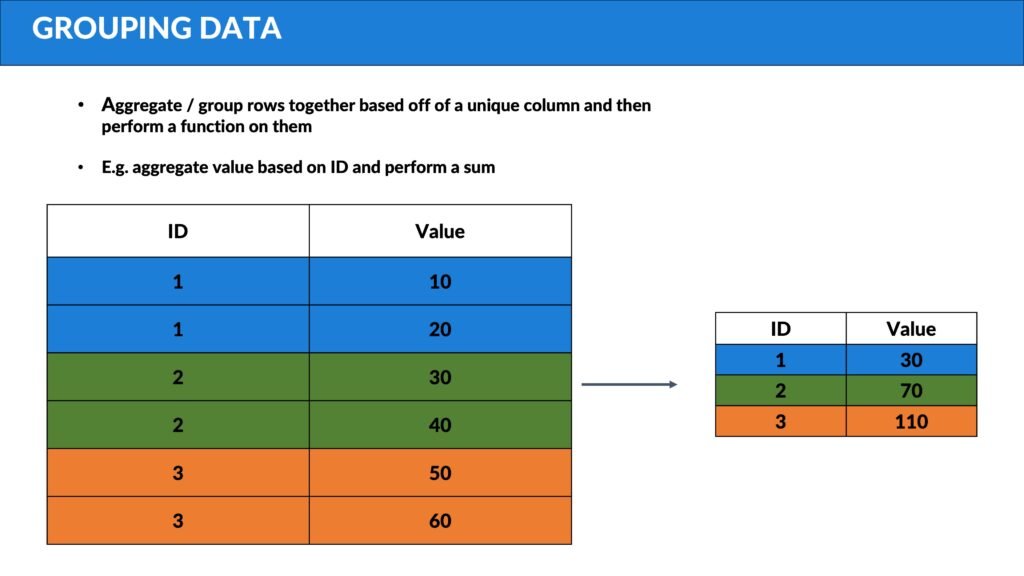
Pandas Data Manipulation
Master Pandas for complex data operations—reading and writing data, DataFrame manipulation, grouping and aggregation, handling missing data, and merging datasets.
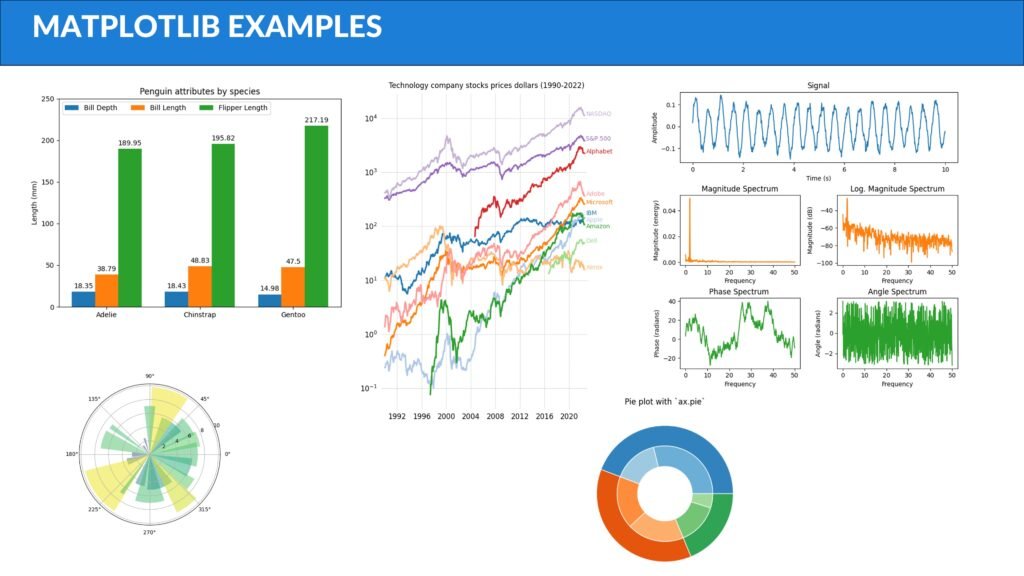
Data Visualisation
Create compelling visualisations with Matplotlib and Seaborn. Learn different plot types, customisation techniques, and how to present data insights that drive decisions.
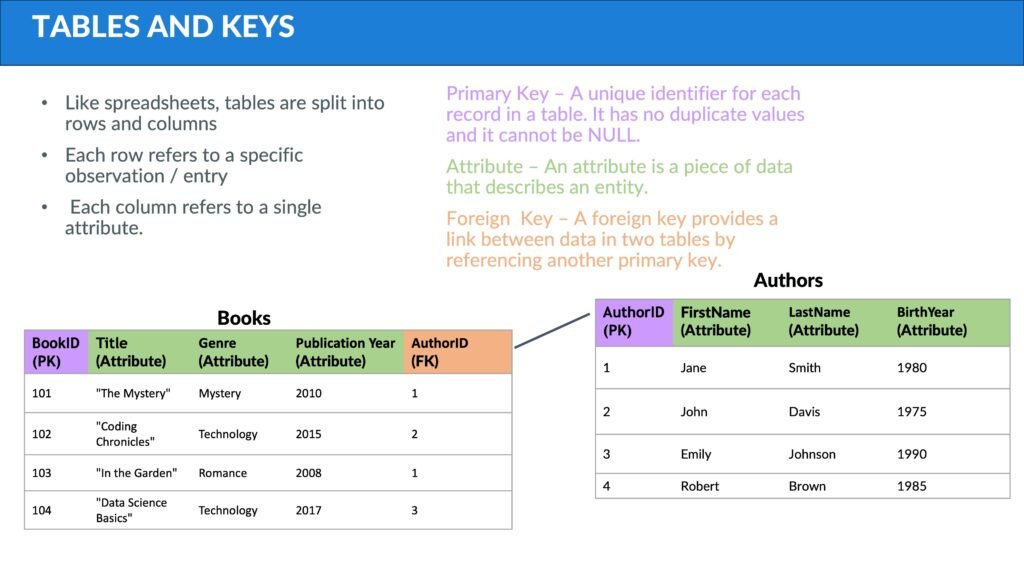
SQL & Databases
Query databases effectively with SQL. Learn database fundamentals, SELECT statements, joins, filtering and grouping data, aggregate functions, and exporting results for analysis.
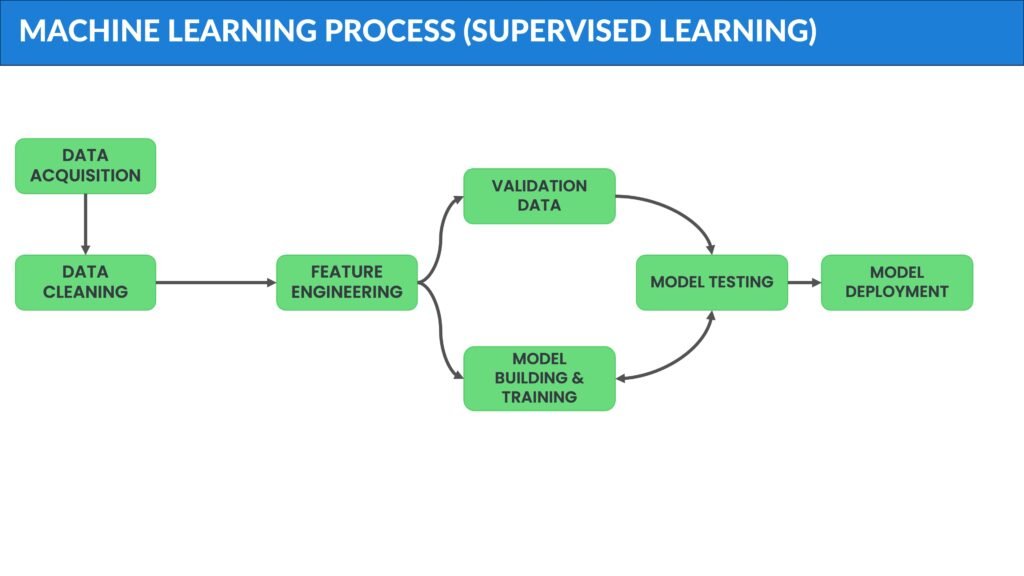
Machine Learning Intro
Get started with machine learning using Scikit-Learn. Learn data preparation, model creation, logistic regression, and how to apply ML techniques to real-world data problems.
Portfolio Projects
Build complete end-to-end projects that demonstrate your data analysis abilities. Clean real-world data, perform exploratory analysis, create visualizations, and present actionable insights.
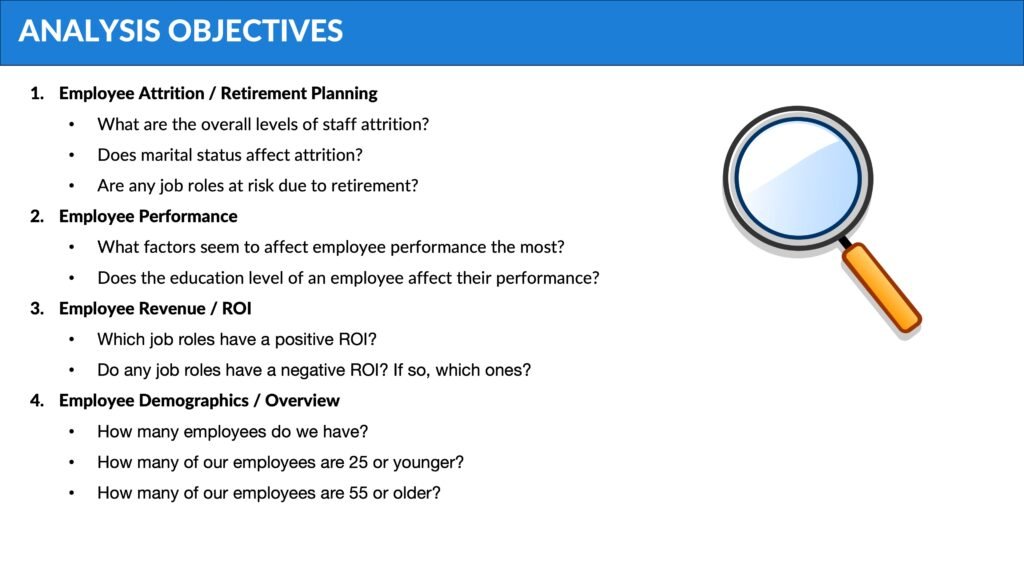
COURSE PROJECTS
BUILD A PORTFOLIO THAT PROVES YOU CAN DO THE WORK.
Don’t just learn theory. Build real projects that demonstrate your ability to analyse data, extract insights, and present findings professionally.
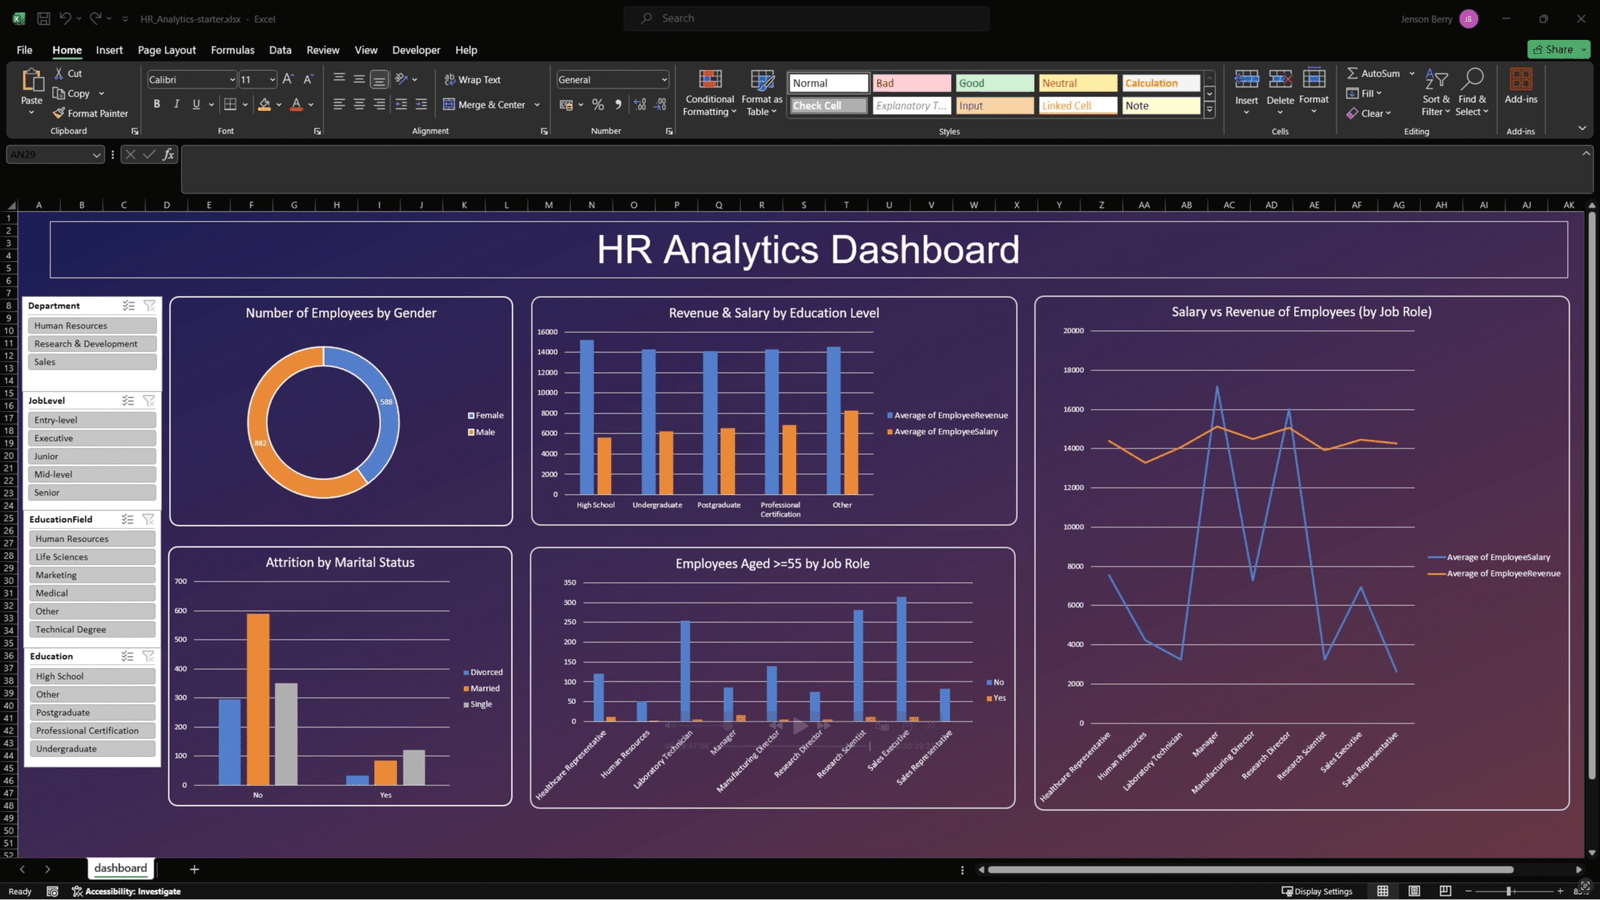
Project 1: HR Analytics Dashboard (Excel)
Build a complete HR analytics dashboard in Excel using human resources worker data. Clean messy data, create PivotTables, design professional charts, and present insights that drive decisions.
SKILLS USED:
→ Excel data cleaning and preparation
→ PivotTables and PivotCharts
→ Advanced formulas and functions
→ Dashboard design and visualisation
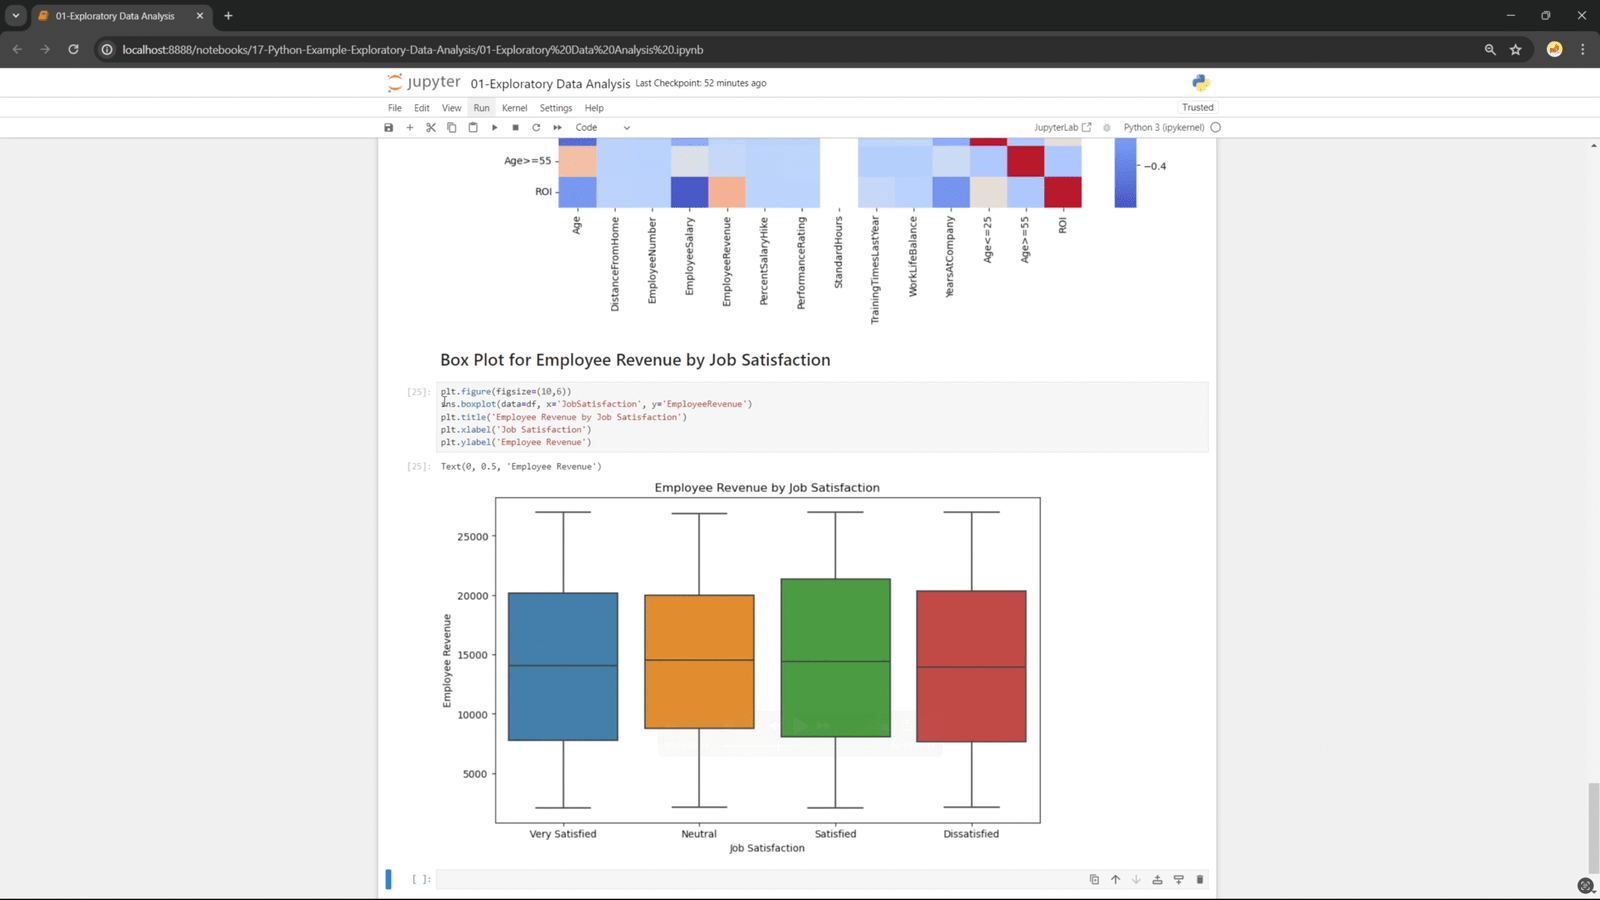
Project 2: HR Analytics Transition to Python
Take the same HR dataset from Project 1 and recreate the analysis using Python, Pandas, Matplotlib, and Seaborn. Learn how to translate familiar Excel analysis into code—a critical skill for scaling your data analysis work beyond spreadsheet limitations.
SKILLS USED:
→ Python programming and Pandas data manipulation
→ Data cleaning and preprocessing with Python
→ Creating visualisations with Matplotlib and Seaborn
→ Statistical analysis and correlation heatmaps
→ Translating Excel logic into Python code
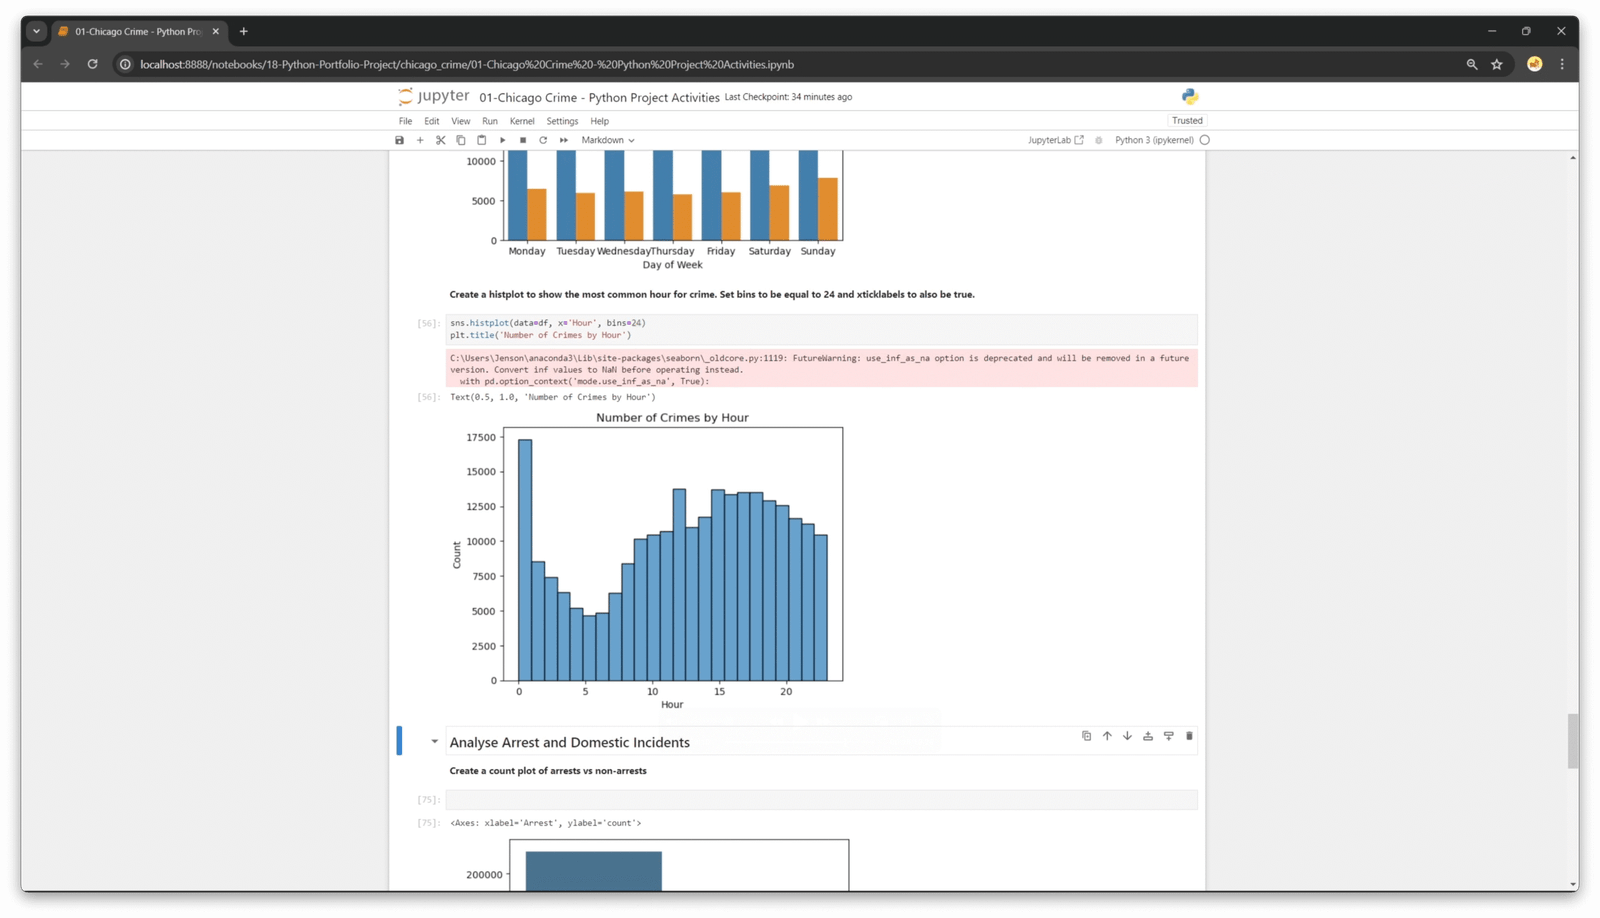
Project 3: Chicago Crime Analysis (Capstone)
Analyse 250,000+ Chicago crime records to identify patterns, trends, and insights. Complete the full data analysis pipeline: clean messy real-world data, perform exploratory analysis, create compelling visualisations, and extract actionable insights about crime patterns.
SKILLS USED:
→ Handling large datasets (250k+ records)
→ Advanced data cleaning (missing values, data types, duplicates)
→ Feature engineering (extracting month, hour, day from dates)
→ Temporal analysis and pattern identification
→ Creating professional visualisations that tell stories
Project 4: Data Analyst Salary Analysis (Extra)
Analyse real data analyst job postings from Glassdoor to understand salary trends, required skills, and market insights. Perform comprehensive exploratory analysis, build correlation matrices, and extract insights about what drives data analyst compensation.
SKILLS USED:
→ Multi-dimensional data analysis
→ Pivot tables and groupby operations in Pandas
→ Advanced visualisation techniques (heatmaps, box plots, bar charts)
→ Correlation analysis between multiple variables
→ Statistical analysis and trend identification
Testimonials
What students are saying
From what I’ve seen so far, this is an excellent course. It’s clear, well presented and well explained. The content list looks like exactly what I need. I’ve skipped around a bit and the style is consistent.
Halfway through and I still think it’s excellent.
Colin M.
He explains things clearly. Explaining all the necessary steps in order. I’m pleased that I took this course. The las recommendations were also valuable. Thank you.
Yuşa K.
I was very well informed by these lectures. The explanations were complete and used good logic to explain the right way to approach the material. I knew some of these tasks already, and they were perfectly explained using the correct method, so I believe the other new information was also excellently presented. I am happy to learn from this course with its very good resources and examples.
Atul S.
GET STARTED
Ready to Start?
🚀 Recently Updated
The Complete Data Analyst Course
£109
£299
Master the complete data analyst toolkit. Learn Excel, Python, Pandas, SQL, and data visualisation through practical projects that prove you can do the work.
💚 30-DAY MONEY BACK GUARANTEE
FAQ’s
Got Questions?
We’ve Got Answers.
Q. Do I need programming experience?
A: No. The course includes a complete Python crash course starting from absolute basics. If you can use a computer, you can learn data analysis. Prior Excel knowledge is helpful but not required.
Q. How long does the course take to complete?
The course contains 15+ hours of video content. Most students complete it in 6-10 weeks studying 2-4 hours per week while working full-time. You can go faster if you’re motivated or take longer— the content is yours forever.
Q. What tools do I need?
Just a computer (Windows or Mac). All software used in the course is free: Excel (or Google Sheets as a free alternative), Python (Anaconda), and SQL. I’ll show you exactly how to install and set up everything.
Q. Is this course regularly updated?
Yes. You get lifetime access including all future updates. Data analysis tools and best practices evolve, and the course content evolves with them.
Q. What can I do after completing this course?
You’ll have the practical skills to apply for data analyst positions, analyze data in your current role, or freelance as a data analyst. You’ll have portfolio projects that demonstrate your abilities to potential employers.
Q. Will this help me get a data analyst job?
This course teaches the technical skills employers need. Many students have successfully transitioned into data analyst roles after completing the course. Your success depends on your effort in applying what you learn and continuing to develop your skills.
Q. Do I get lifetime access?
Yes, once enrolled, you’ll have lifetime access to all the course materials, including any future updates.